


A Graphical Analysis of attacking and defensive effectiveness among Europe's top divisions
Page 1 of 2 • 1, 2 ![]()
![]()
 A Graphical Analysis of attacking and defensive effectiveness among Europe's top divisions
![]() by S Wed Jan 23, 2013 7:50 am
by S Wed Jan 23, 2013 7:50 am

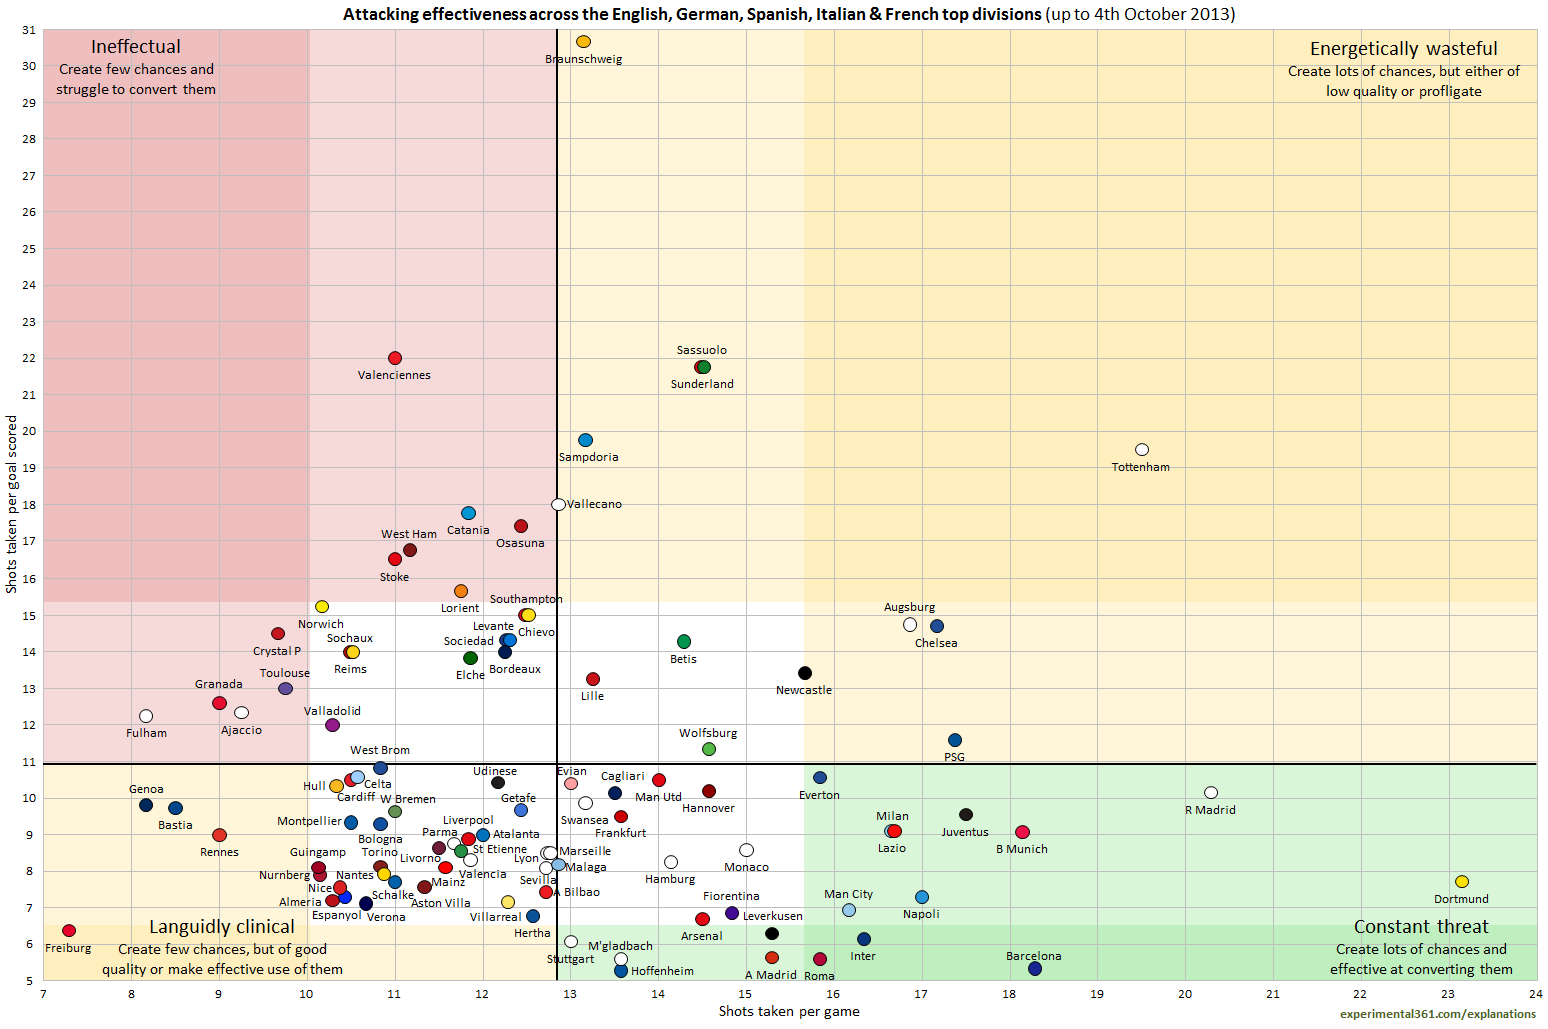
Click on the image to see enlarged version.
- Juventus take the most shots per match – while Real Madrid aren’t far behind, both they and Bayern are more efficient at converting chances.
- What’s interesting is that Hannover just edge Man Utd as the second most clinical side here, although the Premier League leaders fashion an average of 3 additional chances per match to give them a greater overall goal threat.
- Barcelona are the most clinical team in front of goal, requiring an average of just over 4 shots to score each goal while La Liga stablemates Osasuna are the most wasteful, needing almost 4 times as many.
- At least Osasuna are having a respectable amount of shots on goal, which is more than can be said for Greuther Fürth. Aston Villa and Reims join them in being an unwanted outlier for both chance creation and conversion
Defending:

Click on the image to see enlarged version.
- Bayern and PSG are significantly tougher to break down than any other side here, with both able to soak up an average of around 20 shots before conceding. The former are also the best here at restricting their opponents’ chances, although Atlético Madrid and Marseille aren’t far behind.
- Nobody has to face more shots than Pescara, who have to endure almost 18 per match while the easiest defence to breach is that of Hoffenheim, which requires just over 5 shots.
Interesting article.Just thought i'd post it here.
http://experimental361.com/2013/01/21/attacking-effectiveness-europe/

S- Ballon d'Or Contender

- Club Supported :

Posts : 28505
Join date : 2011-06-05
Age : 32
![]()
![]()
Re: A Graphical Analysis of attacking and defensive effectiveness among Europe's top divisions
![]() by Onyx Wed Jan 23, 2013 10:33 am
by Onyx Wed Jan 23, 2013 10:33 am

Their defending must be impressive.
Onyx- Forum Legend

- Club Supported :

Posts : 40128
Join date : 2011-06-05
![]()
![]()
Re: A Graphical Analysis of attacking and defensive effectiveness among Europe's top divisions
![]() by rwo power Wed Jan 23, 2013 10:36 am
by rwo power Wed Jan 23, 2013 10:36 am

rwo power- Super Moderator

- Club Supported :

Posts : 20978
Join date : 2011-06-05
![]()
![]()
Re: A Graphical Analysis of attacking and defensive effectiveness among Europe's top divisions
![]() by Nirgall Wed Jan 23, 2013 11:58 am
by Nirgall Wed Jan 23, 2013 11:58 am
Btw, the images are too low quality and I can't read the names under the circles.

Nirgall- Hot Prospect

- Club Supported :

Posts : 447
Join date : 2011-10-05
![]()
![]()
Re: A Graphical Analysis of attacking and defensive effectiveness among Europe's top divisions
![]() by rwo power Wed Jan 23, 2013 12:45 pm
by rwo power Wed Jan 23, 2013 12:45 pm
Klick twice at the pic, first click makes it fit into the window, second click gives the real large size.Nirgall wrote:Btw, the images are too low quality and I can't read the names under the circles.
rwo power- Super Moderator
- Club Supported :
Posts : 20978
Join date : 2011-06-05
![]()
![]()
Re: A Graphical Analysis of attacking and defensive effectiveness among Europe's top divisions
![]() by futbol Wed Jan 23, 2013 1:11 pm
by futbol Wed Jan 23, 2013 1:11 pm
rwo power wrote:Well, the Bayern defense is always highly underrated. They had similar stats last season, too. People really should give Badstuber, Boateng and now Dante more credit. (And Manuel Neuer of course)
IMO it's rather overrated. Conceded 7 goals in 6 CL games in a group with BATE and Lille. 2 more than Valencia who aren't anything special this season. As many as in 18 Bundesliga games! I mean their defense is good obviously but not "7 goals in 18 games" good whereas other top teams like Real Madrid and Barcelona both conceded 3 times as many in the same time frame. Doesn't shed a good light on the Bundesliga tbh.
futbol- World Class Contributor

- Club Supported :

Posts : 11254
Join date : 2012-11-23
![]()
![]()
Re: A Graphical Analysis of attacking and defensive effectiveness among Europe's top divisions
![]() by ELO Wed Jan 23, 2013 1:24 pm
by ELO Wed Jan 23, 2013 1:24 pm
Especially if you look at Dortmund and Schalke who conceded less goals than Bayern in tougher CL groups.
And the only reason Bayern has this bad cl statistic at this point is the one horrible game against bate.

ELO- Hot Prospect
- Posts : 243
Join date : 2011-06-06
![]()
![]()
Re: A Graphical Analysis of attacking and defensive effectiveness among Europe's top divisions
![]() by rwo power Wed Jan 23, 2013 1:29 pm
by rwo power Wed Jan 23, 2013 1:29 pm
On the other hands, if you look at the CL goals...The goal by BATE in Munich was scored in the 89th minute when the team obviously was in the dressing room already, same with the goal that Valencia scored in the 90+1 minute in Munich and the one goal that Lille scored in Munich was when Bayern already lead 5:0. So you sort of can count out three of the goals as they were more allowed by sheer laziness when the matches were already safely won.futbol wrote:IMO it's rather overrated. Conceded 7 goals in 6 CL games in a group with BATE and Lille. 2 more than Valencia who aren't anything special this season. As many as in 18 Bundesliga games! I mean their defense is good obviously but not "7 goals in 18 games" good whereas other top teams like Real Madrid and Barcelona both conceded 3 times as many in the same time frame. Doesn't shed a good light on the Bundesliga tbh.
The only worrying goals they got in were the first two by BATE in Belarus (where the whole Bayern team had a collective blackout; the 3rd was in the 90+4 minute when Bayern had everyone in BATE's half trying to get the equalizer) and the one they got in Valencia.
rwo power- Super Moderator
- Club Supported :
Posts : 20978
Join date : 2011-06-05
![]()
![]()
Re: A Graphical Analysis of attacking and defensive effectiveness among Europe's top divisions
![]() by futbol Wed Jan 23, 2013 2:19 pm
by futbol Wed Jan 23, 2013 2:19 pm
futbol- World Class Contributor
- Club Supported :
Posts : 11254
Join date : 2012-11-23
![]()
![]()
Re: A Graphical Analysis of attacking and defensive effectiveness among Europe's top divisions
![]() by The Franchise Wed Jan 23, 2013 2:23 pm
by The Franchise Wed Jan 23, 2013 2:23 pm
Its not that thier defenders or defending is any better or worse, its just the other team has more of the ball than in the league and therefore more chances to score.

The Franchise- Admin

- Club Supported :
Posts : 19651
Join date : 2011-06-05
Age : 37
![]()
![]()
Re: A Graphical Analysis of attacking and defensive effectiveness among Europe's top divisions
![]() by ELO Wed Jan 23, 2013 2:34 pm
by ELO Wed Jan 23, 2013 2:34 pm
Bayern:
CL 1,16
Buli 0.38
Schalke:
CL 1,0
Buli 1,6
BVB:
CL 0,83
Buli 1,1
So if you look at this data how does it oprove your point
ELO- Hot Prospect
- Posts : 243
Join date : 2011-06-06
![]()
![]()
Re: A Graphical Analysis of attacking and defensive effectiveness among Europe's top divisions
![]() by futbol Wed Jan 23, 2013 2:54 pm
by futbol Wed Jan 23, 2013 2:54 pm
ELO wrote:...again, the thing is, you just look at selective data to prove the point that Bundesliga has week defending, when Dortmund and Schalke have conceded way more goals in BuLi than in CL.
I never implied "Bundesliga has weak defending", although Schalke's and Dortmund's records this season don't prove the opposite either based on 6 games alone and considering how badly Dortmund did last year in the CL and the fact that they were very lucky to play against Madrid in their worst shape in the whole Mourinho era and against a City team which didn't even win a single home game in Europe, not even against Ajax (nevermind that they tried to avoid getting into the Europa League in their last game and pretty much didn't even bother to play). The names were bigger than the performances those teams put in. The sample size of Bayern games is much bigger over the last 2 seasons however. 18 games is very accurate. In which Bayern conceded 18 goals = 1.0 goal per game. Whereas in the Bundesliga over the past 2 seasons they are averaging 0.56 goals per game. There is a clear mismatch for everyone to see.
BUT. I wasn't implying that Bundesliga has weak defending anyway. I was rather implying that Bundesliga teams are somehow shit at exploiting Bayern's defense in particular. Don't know why. Maybe they are shitscared of the name "Bayern" and park the bus instead of going for it.
futbol- World Class Contributor
- Club Supported :
Posts : 11254
Join date : 2012-11-23
![]()
![]()
Re: A Graphical Analysis of attacking and defensive effectiveness among Europe's top divisions
![]() by rwo power Wed Jan 23, 2013 4:41 pm
by rwo power Wed Jan 23, 2013 4:41 pm
Interestingly, in the BATE matches where Bayern got 4 goals against (that is more than half the goals they got in all the CL this season), Bayern had 66% possession in both their 3:1 loss and the 4:1 win, so the possession argument isn't so clear either.
Numbers according to kicker.de:
- Spoiler:
- BATE 3:1 Bayern
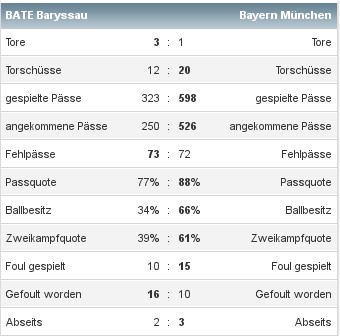
Bayern 4:1 BATE
 ), while in the other, BATE got 1 goal out of 10 attempts (90% save rate) while Bayern got 4 goals out of 16 attempts (25% = pretty clinical).
rwo power- Super Moderator
- Club Supported :
Posts : 20978
Join date : 2011-06-05
![]()
![]()
Re: A Graphical Analysis of attacking and defensive effectiveness among Europe's top divisions
![]() by BarrileteCosmico Wed Jan 23, 2013 6:22 pm
by BarrileteCosmico Wed Jan 23, 2013 6:22 pm

BarrileteCosmico- Admin
- Club Supported :

Posts : 28289
Join date : 2011-06-05
Age : 33
![]()
![]()
Re: A Graphical Analysis of attacking and defensive effectiveness among Europe's top divisions
![]() by ELO Wed Jan 23, 2013 6:24 pm
by ELO Wed Jan 23, 2013 6:24 pm
i dont't even think it's surprising, since the competition in the CL should be harder than in the BL. I mean, they had to play against the best teams from England, Italy, Spain, etc and not against BuLi relegation sides.
And you can downplay Dortmunds opponents all you want, they still had one of the hardest groups and had to play against the current 3rd of La Liga and 2nd of the EPL.
ELO- Hot Prospect
- Posts : 243
Join date : 2011-06-06
![]()
![]()
Re: A Graphical Analysis of attacking and defensive effectiveness among Europe's top divisions
![]() by Albiceleste Wed Jan 23, 2013 6:28 pm
by Albiceleste Wed Jan 23, 2013 6:28 pm

ligue 1
you'd probably get a better conclusion if you just ignore psg and bayern.
Albiceleste- World Class Contributor
- Club Supported :

Posts : 11137
Join date : 2011-06-06
Age : 29
![]()
![]()
Re: A Graphical Analysis of attacking and defensive effectiveness among Europe's top divisions
![]() by The Franchise Wed Jan 23, 2013 6:34 pm
by The Franchise Wed Jan 23, 2013 6:34 pm
rwo power wrote:@Franchise:
Interestingly, in the BATE matches where Bayern got 4 goals against (that is more than half the goals they got in all the CL this season), Bayern had 66% possession in both their 3:1 loss and the 4:1 win, so the possession argument isn't so clear either.
Numbers according to kicker.de:The main difference is that in the first match, BATE got 3 goals out of 12 attempts (only 75% save rate with clinical BATE strikers) while Bayern only got 1 goal out of 20 attempts (5% = extremely wasteful
- Spoiler:
Bayern 4:1 BATE
Well sure, but thats just one game. Like like Barca let in 4 vs Deportivo in La Liga despite having 70%
I was talking more about the entire competition and I guess that spreads to last season too.
The Franchise- Admin
- Club Supported :
Posts : 19651
Join date : 2011-06-05
Age : 37
![]()
![]()
Re: A Graphical Analysis of attacking and defensive effectiveness among Europe's top divisions
![]() by rwo power Wed Jan 23, 2013 7:00 pm
by rwo power Wed Jan 23, 2013 7:00 pm
Let's see...The Franchise wrote:I was talking more about the entire competition and I guess that spreads to last season too.
According to whoscored.com, Bayern have an average possession of 63.7% (87.7% pass success) in the BL. In the CL they have 61% possession (88.2% pass success). In comparison, Barcelona have an average possession of ( pass success) in La Liga and 75.5% possession (91.6% pass success) in the CL.
Putting this in relation:
Barca: 69.0% (89.8%) La Liga // 75.5% (91.6%) CL
Bayern: 63.7% (87.7%) BL // 61.0% (88.2%) CL
ManCity: 58.8% (86.0%) EPL // 54.6% (85.2%) CL
Juventus: 58.7% (85.8%) Serie A // 48.7% (83.2%) CL
Man Utd: 57.4% (86.4%) EPL // 60.3% (88.9%) CL
PSG: 56.1 (86.1%) Ligue 1 // 52.1% (86.2%) CL
Real: 56.1% (80.2%) La Liga // 51.0% (82.8%) CL
Chelsea: 55.4% (84.0%) EPL // 52.7% (86.4%) CL
Dortmund: 55.3% (80.5%) BL // 39.8% (78.7%) CL
It's interesting that Barca is the only team that actually has more possession in the CL (okay, ManUtd, too, but comparatively less) o_O
Contrarily, Dortmund and a bit less Juve have no problems ceding possession in the CL and still staying successful so far.
rwo power- Super Moderator
- Club Supported :
Posts : 20978
Join date : 2011-06-05
![]()
![]()
Attacking Comparison of Top 5 Leagues
![]() by McAgger Sat Oct 05, 2013 5:02 am
by McAgger Sat Oct 05, 2013 5:02 am

McAgger- Ballon d'Or Contender
- Club Supported :

Posts : 28318
Join date : 2011-06-05
Age : 107
![]()
![]()
Re: A Graphical Analysis of attacking and defensive effectiveness among Europe's top divisions
![]() by Kick Sat Oct 05, 2013 5:11 am
by Kick Sat Oct 05, 2013 5:11 am
Dortmund
Great graph there.

Kick- Admin
- Club Supported :

Posts : 34814
Join date : 2011-06-06
Age : 30
![]()
![]()
Re: A Graphical Analysis of attacking and defensive effectiveness among Europe's top divisions
![]() by Forza Sat Oct 05, 2013 5:50 am
by Forza Sat Oct 05, 2013 5:50 am

Forza- Fan Favorite

- Club Supported :

Posts : 8871
Join date : 2011-06-07
![]()
![]()
Re: A Graphical Analysis of attacking and defensive effectiveness among Europe's top divisions
![]() by CBarca Sat Oct 05, 2013 6:32 am
by CBarca Sat Oct 05, 2013 6:32 am

CBarca- NEVER a Mod
- Club Supported :

Posts : 20401
Join date : 2011-06-17
Age : 27
![]()
![]()
Re: A Graphical Analysis of attacking and defensive effectiveness among Europe's top divisions
![]() by aleumdance Sat Oct 05, 2013 6:46 am
by aleumdance Sat Oct 05, 2013 6:46 am
really great stat
data

aleumdance- First Team

- Club Supported :

Posts : 2943
Join date : 2011-12-11
![]()
![]()
Re: A Graphical Analysis of attacking and defensive effectiveness among Europe's top divisions
![]() by BarrileteCosmico Sat Oct 05, 2013 8:19 am
by BarrileteCosmico Sat Oct 05, 2013 8:19 am
Surprised at Inter's position.
BarrileteCosmico- Admin
- Club Supported :
Posts : 28289
Join date : 2011-06-05
Age : 33
![]()
![]()
Re: A Graphical Analysis of attacking and defensive effectiveness among Europe's top divisions
![]() by jibers Sat Oct 05, 2013 8:32 am
by jibers Sat Oct 05, 2013 8:32 am

jibers- World Class Contributor
- Club Supported :

Posts : 10241
Join date : 2011-06-06
![]()
![]()
Re: A Graphical Analysis of attacking and defensive effectiveness among Europe's top divisions
![]() by Sponsored content
by Sponsored content
Sponsored content
![]()
![]()
Page 1 of 2 • 1, 2 ![]()
![]()

 Similar topics
» Does it require more talent to be an attacking player than a defensive one?
» Was MSN the best attacking trio ever?
» Emery : with time, you can only take care of technique and attacking freedom, losing your defensive structure.
» Predict the TOP 4 of Europes Top 5 Leagues
» Manga and Anime
» Premier League 2023/24
» Introduce yourself to the community - Topic 2
» Real Refdrid, Real Uefadirt, different names, same schemes.
» La Liga 2023/24
» Florentino Perez - man of mystery!
» The Official Dwayne Wade <<<<<< you thread
» Serie A 2023/24
» Modric considering one more year!
» Political Correctness, LGBTQ, #meToo and other related topics
» Manchester United Part V / ETH Sack Watch
» Bundesliga 2023/24